We are excited to introduce the Rate Variance and new color scheme for your rental rates. Now you can quickly judge how much your rates are changing each day for each month by looking at your rates calendar
Month Variance shows a percentage value of how the daily rate compares to the monthly average. The formula used to calculate monthly variance is as follows:
$var_pct = ( ( $rate_for_the_day / $avg ) * 100 ) – 100
So let’s take an example to understand how variance is calculated for the month of March in London’s locality.
These are the rates for March when the base rate is set as 500. The average rate for the month of March is 495.5.

Now let’s take couple of dates for March to see how variance is calculated:
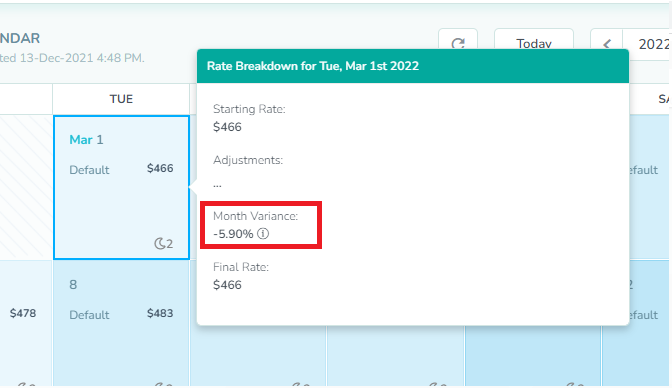
On 1st of March the final rate is $466. If we use that in formula
Variance = ((466/495.5)*100)-100
Variance = -5.95
Similarly if we take the example of 11th March
According to formula: On 11th March the final rate is $526. If we use that in the formula.
Variance = ((526/495.5)*100)-100
Variance = 6.20

Note: Front end has all the values after round off. So there is a chance of little difference in values shown and manually calculated.
The color coding is also done based on the variance. You can also see the monthly variance just by looking at the calendar. If the rate for a specific date is higher than the monthly average, we mark it dark blue and if it’s quite lower, the rate tile will be shown in light blue.
