When it comes to setting the right rates, your market research is critical to your success. The best way to set the correct base rates for your rental property is to see what other properties in your area are charging. Rategenie can help with that too!
How Does Rategenie Know Your Competitor’s Prices?
If you’re already a Tokeet user or have read about any of our companion apps before, you know we take full advantage of integrated services. Cutting edge third-party systems allow us to bring our users the most accurate data available without ever leaving your dashboard.
In this case, we’re speaking about AirDNA’s short-term rental market API. AirDNA’s market insights are the golden standard for accuracy and thoroughness in the VR industry.
They utilize a number of direct listing sources to perform live analysis of over 10,000,000 rental listings across 80,000 cities worldwide. You can be confident in their data – we wouldn’t endorse it otherwise!
How Can I Access Local Market Data?
To start using Rategenie’s local competitor insights, simply log into your dashboard and head to the Rentals page. From there, you can select one of your rental properties to analyze. Click on the rental name to open the overlay page, then navigate to the Market Data page.
-
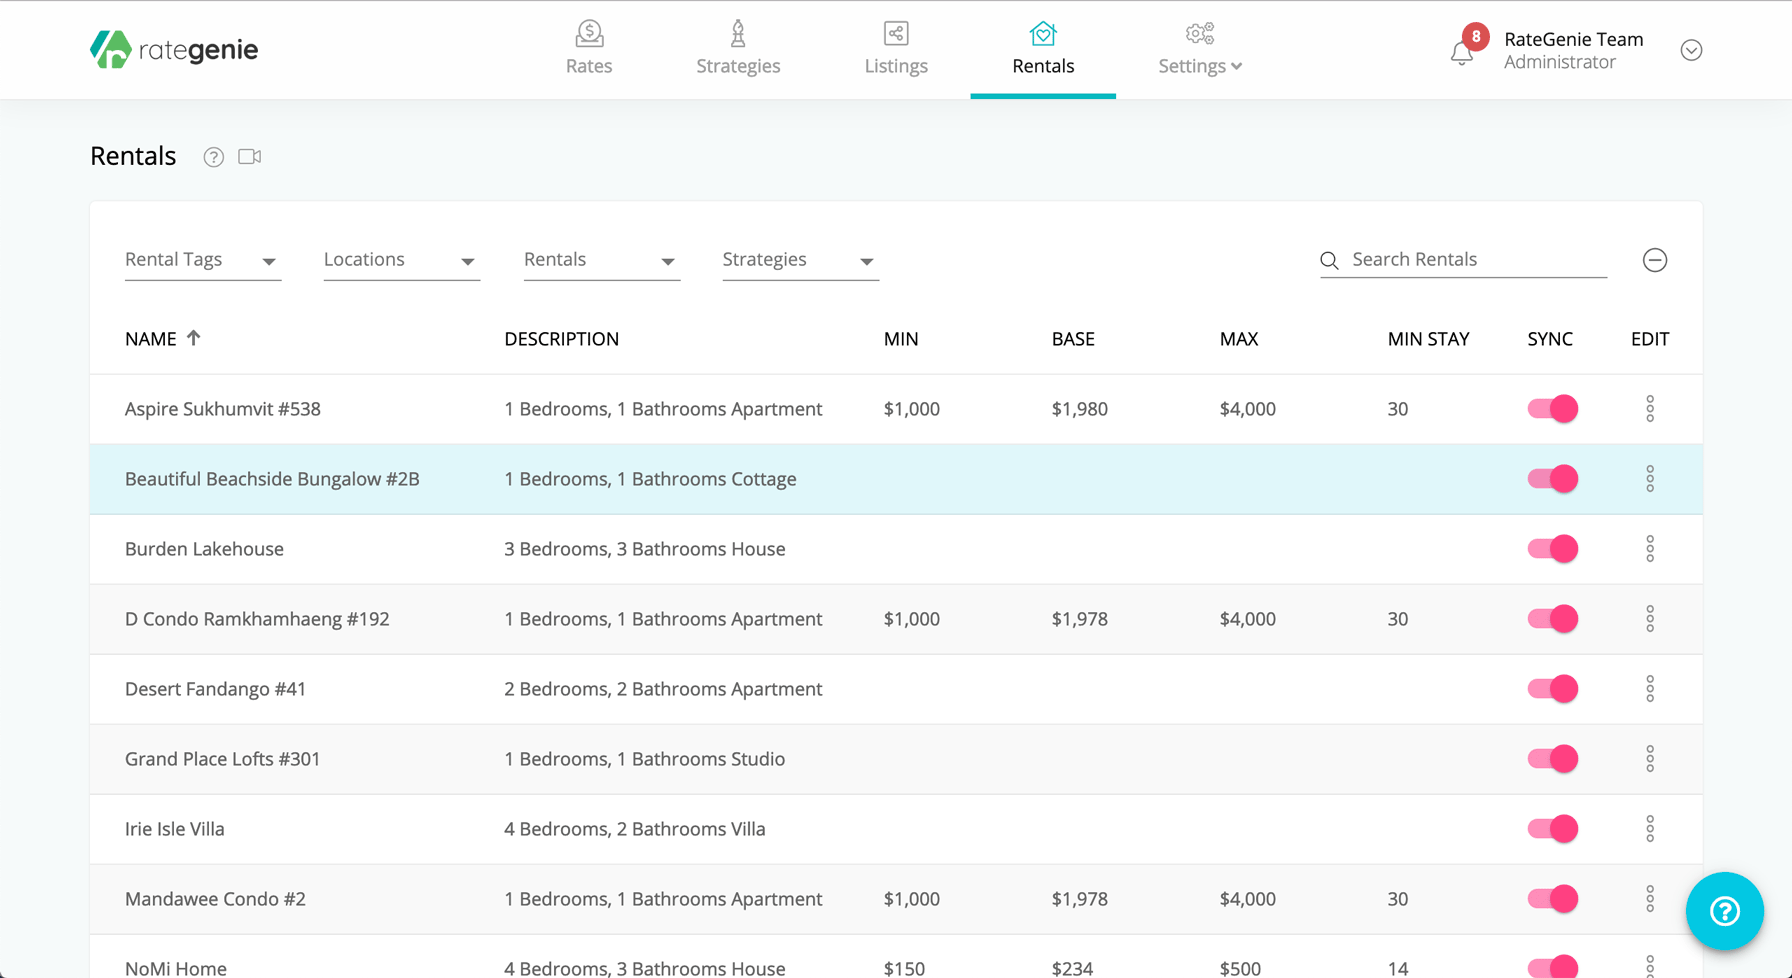
- 1. Navigate to the Rentals page.
-
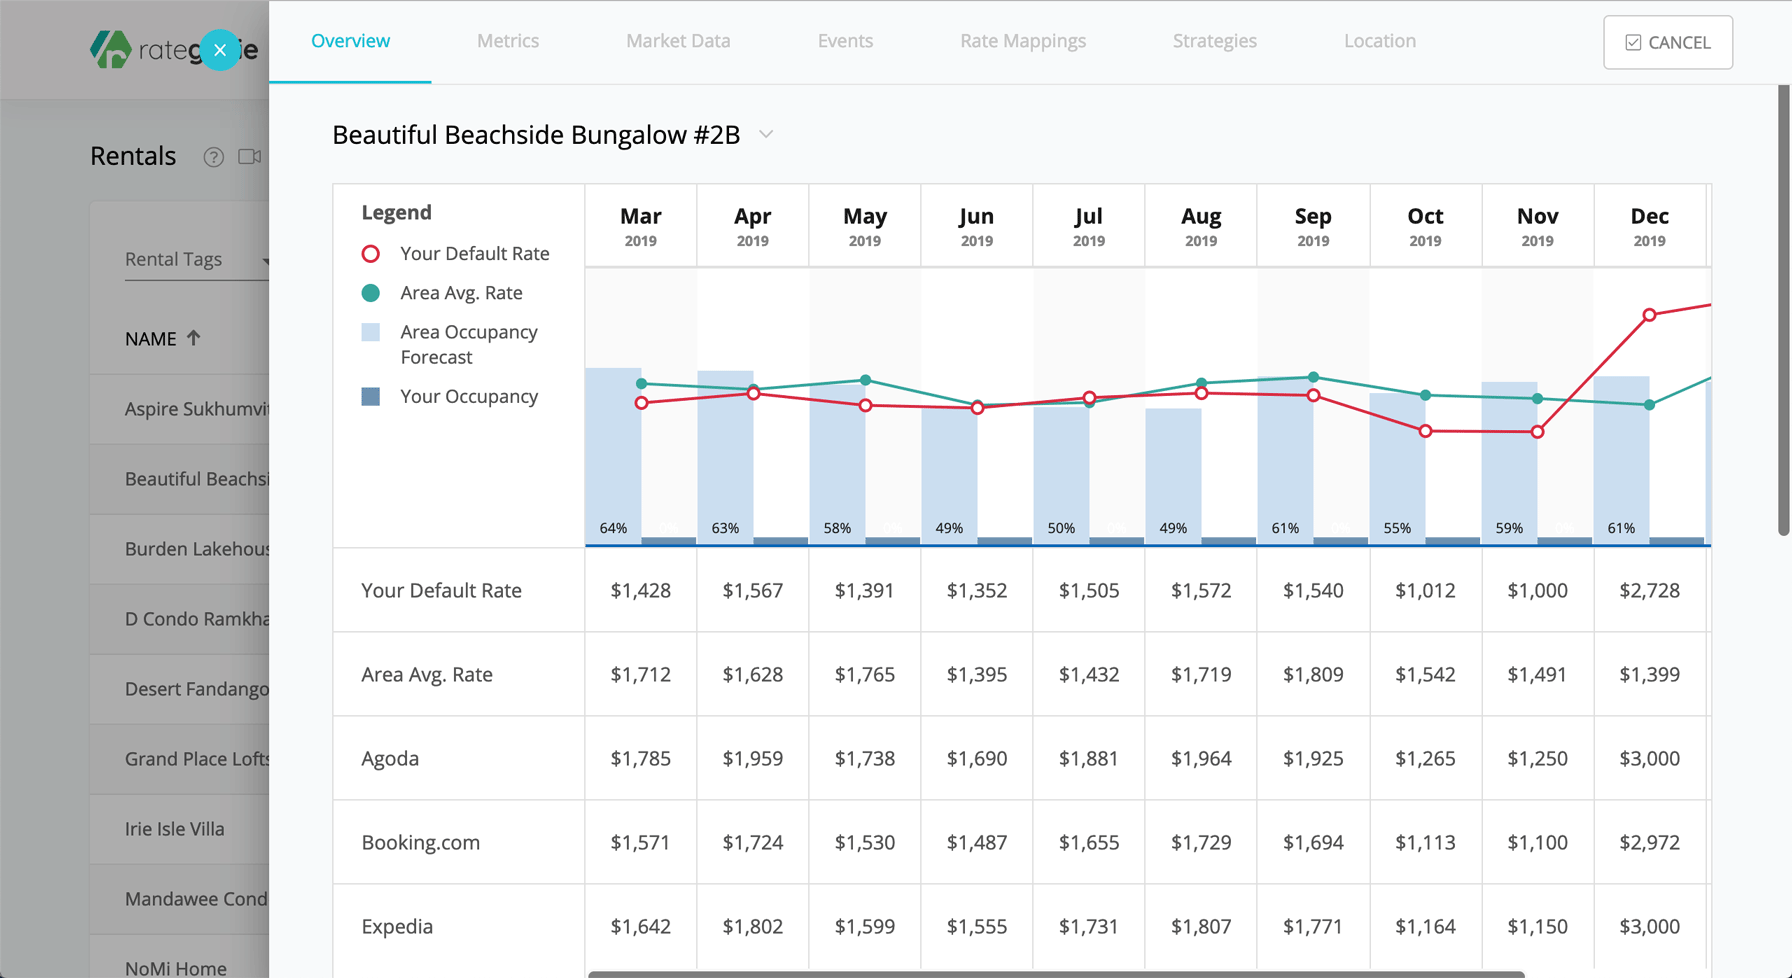
- 2. Click the name of the rental you’d like to analyze.
-
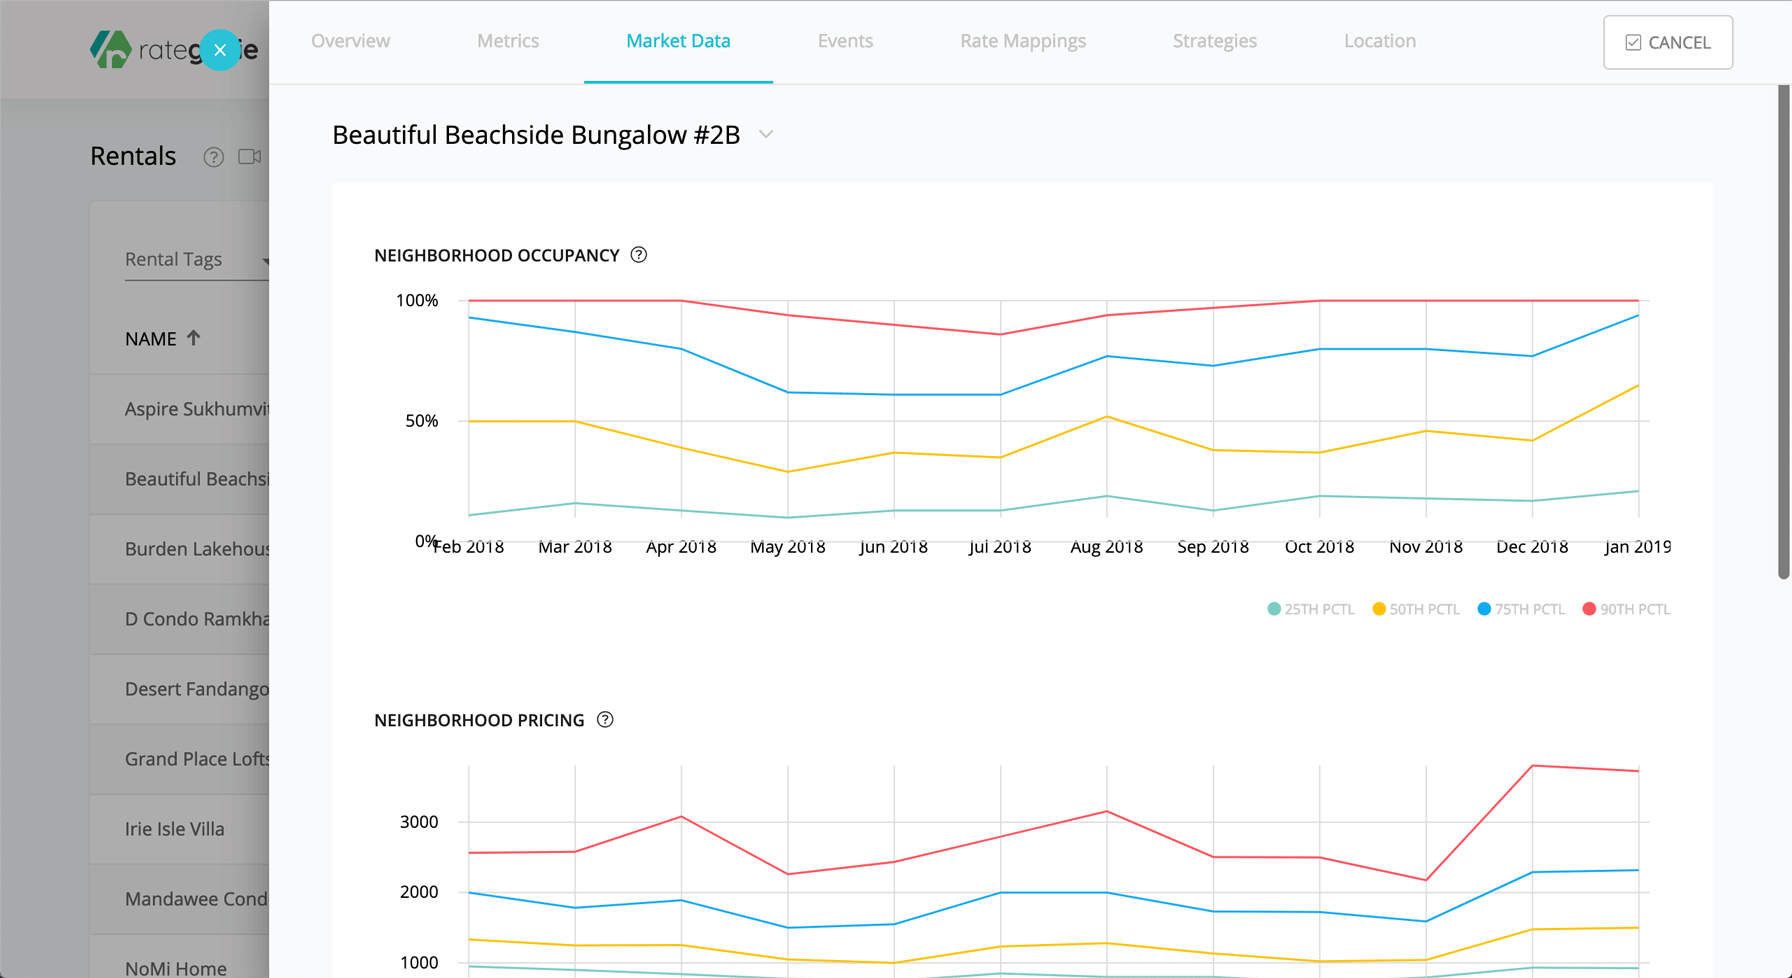
- 3. Navigate to the Market Data tab.
In keeping with Rategenie’s ethos of simplicity, we’ve narrowed a massive amount of data down to a few relevant, actionable insights. Three, to be precise. We’ve also focused the results on rentals with similar specifications to yours to ensure you’re getting data from direct competition.
Neighborhood Occupancy
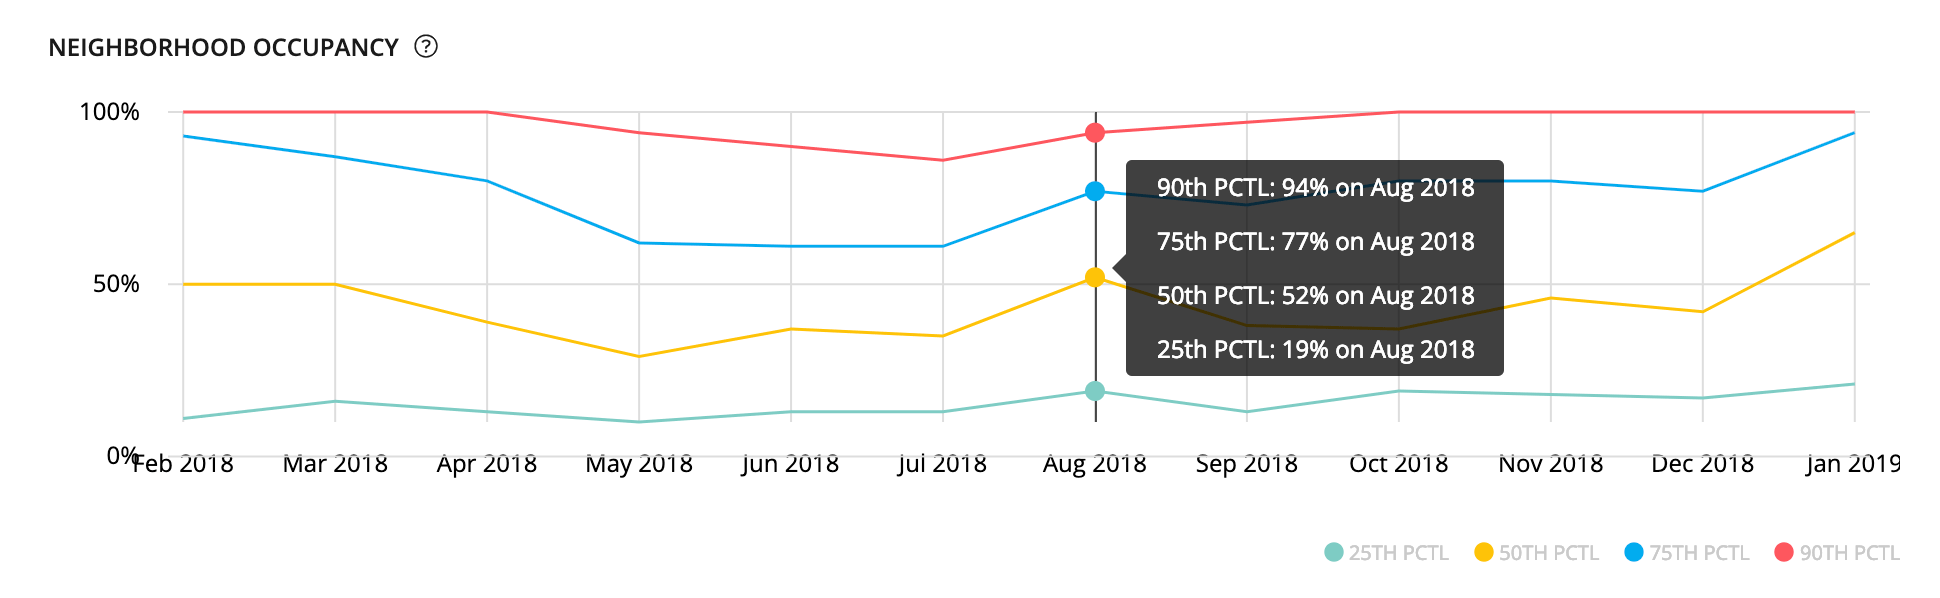
Neighborhood occupancy shows the average occupancy for similar rentals in the region. Price ranges are broken into percentile groups based on pricing (which can be seen below).
Neighborhood Pricing
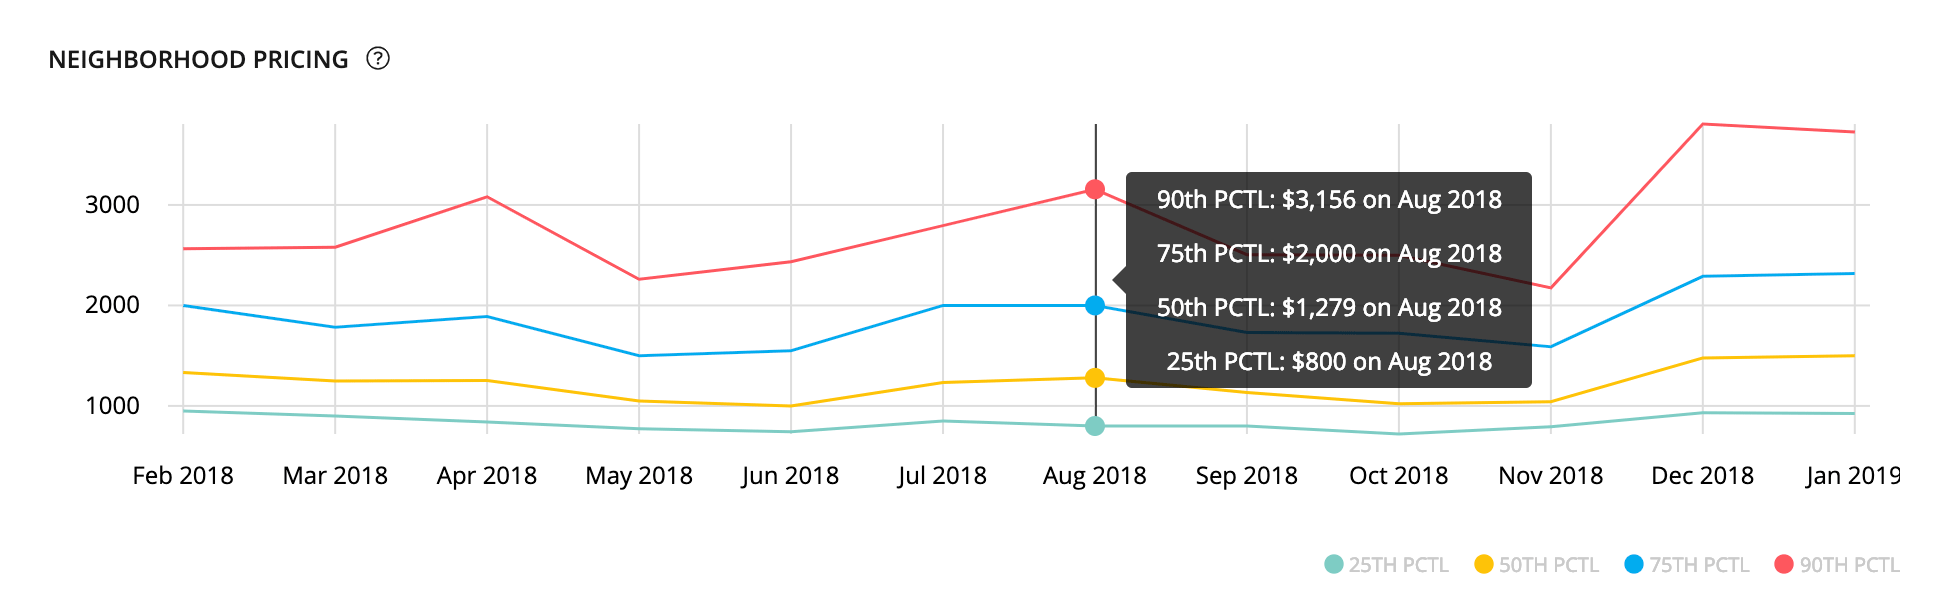
Neighborhood pricing shows the average daily rate for similar rentals in the region. This chart uses the same percentile groups as the Neighborhood Occupancy chart. When you cross the data, you get a very accurate picture of which price points are most competitive, which seasons command higher prices, and how other rentals are responding to demand.
Neighborhood Revpar
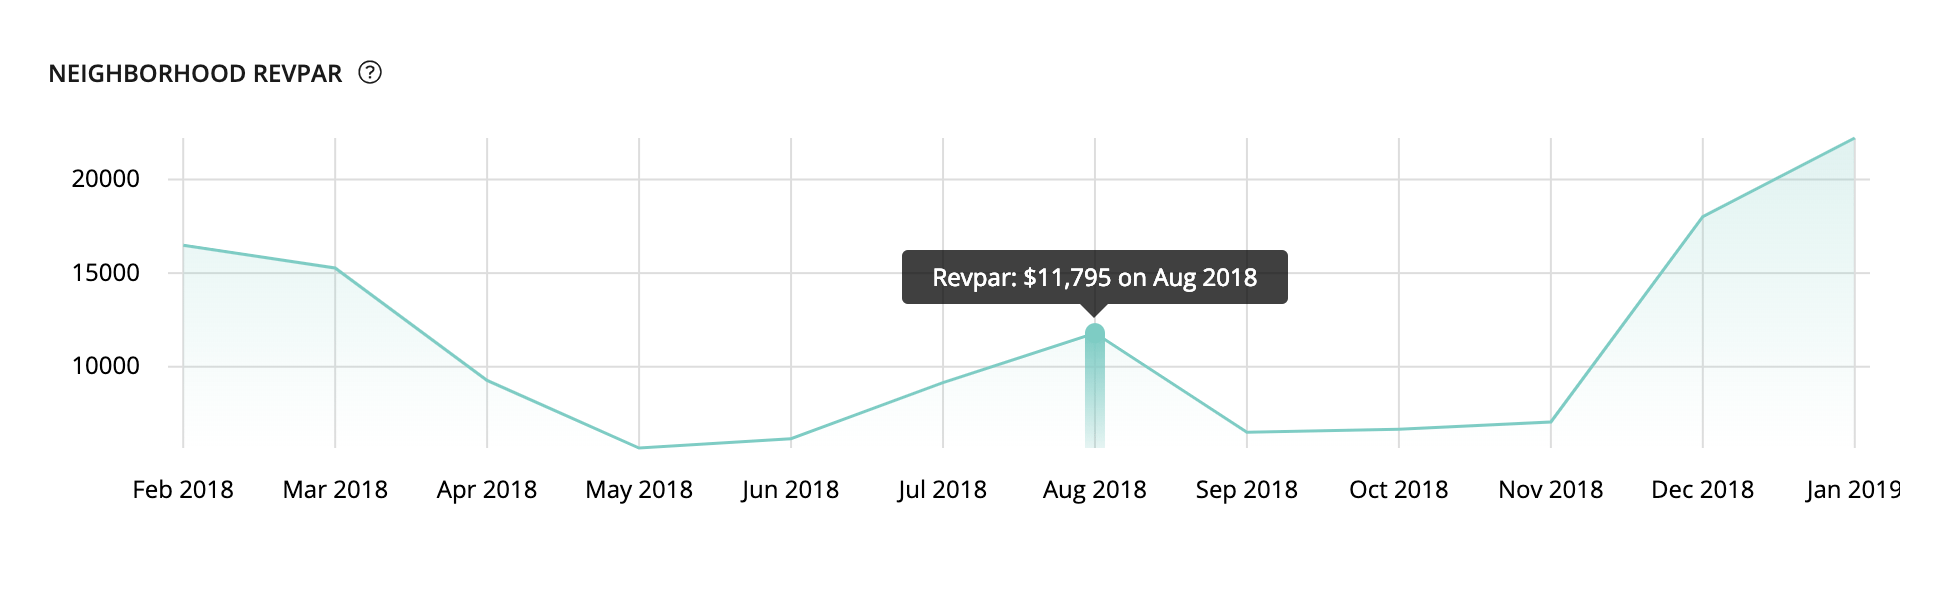
Neighborhood RevPAR shows the average revenue per available rental for similar rentals in the region. This chart will give you a simplified understanding of your area’s seasonal traffic and pricing response.
Before You Begin: A Brief Note On Base Rates
The vacation rental market is one of constant fluctuation. While the age-old strategy of undercutting may increase bookings, your profits will suffer. The VR market is most rewarding to those who respond to the ebb and flow of demand.
Rategenie will handle that for you. You can read more about it in the local events article. All you’re required to do is set a reasonable base rate. As time goes on and your strategy has a chance to work, you’ll be able to tweak your parameters to maximize profits.
In other words, don’t just start out by undercutting everyone – let Rategenie make you some money.